Table of Contents
Quick answer: An affiliate reporting dashboard consolidates your revenue data, spender analytics, and traffic performance into a single view so you can spot trends and make decisions without manually downloading CSVs and building pivot tables every week. Native platform dashboards show basic stats but miss cohort analysis, whale tracking, and cross-account aggregation.
Key takeaways
- Chaturbate's native affiliate dashboard shows transaction history and totals but lacks cohort analysis, spender segmentation, retention tracking, and multi-account aggregation.
- Custom spreadsheets work for basic reporting but break down past 10,000 rows and require 2-4 hours of manual work per week to maintain.
- CB-Stats processes 8M+ transactions and generates cohort matrices, whale tracking, seasonal trend analysis, and account breakdowns automatically from CSV exports.
- The 5 dashboard views every affiliate needs: daily revenue trend, spender retention, whale tracker, traffic source comparison, and monthly year-over-year comparison.
- Automating your reporting workflow saves 8-12 hours per month and eliminates the spreadsheet errors that lead to bad budget decisions.
Why you need a dedicated affiliate reporting dashboard
Native platform dashboards and their limitations
- Shows every transaction with user ID, amount, date, and tracker tag
- Daily and monthly earning totals
- CSV export of full transaction history
- Basic filtering by date range
- Real-time updates as transactions happen
- Group spenders by first purchase month (cohort analysis)
- Track spender retention and churn rates over time
- Identify whale spenders and their activity status
- Compare revenue across multiple affiliate accounts
- Show year-over-year trends and seasonal patterns
- Break down revenue by tracker tag with LTV calculations
- Generate shareable reports for business partners
- Alert you when high-value spenders go inactive
Building custom reports with spreadsheets
Download your CSV monthly
Export the full transaction history from your affiliate dashboard. Chaturbate provides CSV export under the stats section. Download it on the 1st of each month for the previous month.
Import into a master sheet
Append the new data to your master transaction sheet. Make sure columns align (date, user_id, amount, commission, tracker). De-duplicate any overlapping rows if your export includes dates from the previous download.
Build pivot tables
Create pivot tables for: daily revenue (date vs. sum of commission), monthly revenue, tracker-level revenue, and unique spender counts. These are your core reporting views.
Add trend charts
Create line charts from your pivot tables showing daily and monthly revenue trends. Add a 30-day moving average line to smooth out daily noise.
✓ Pros
- +Free (Google Sheets) or already owned (Excel)
- +Full control over data and calculations
- +Good for learning what metrics matter before investing in tools
- +Works fine for new accounts with low transaction volume
✕ Cons
- -Performance breaks down past 10,000-20,000 rows
- -Manual CSV import takes 20-40 minutes per account per month
- -Pivot table errors from misaligned imports are hard to catch
- -Cannot do real-time or automated updates
- -Cohort analysis and retention matrices are extremely tedious to build
- -Sharing reports means sharing the whole spreadsheet or exporting PDFs
CB-Stats as a purpose-built affiliate dashboard
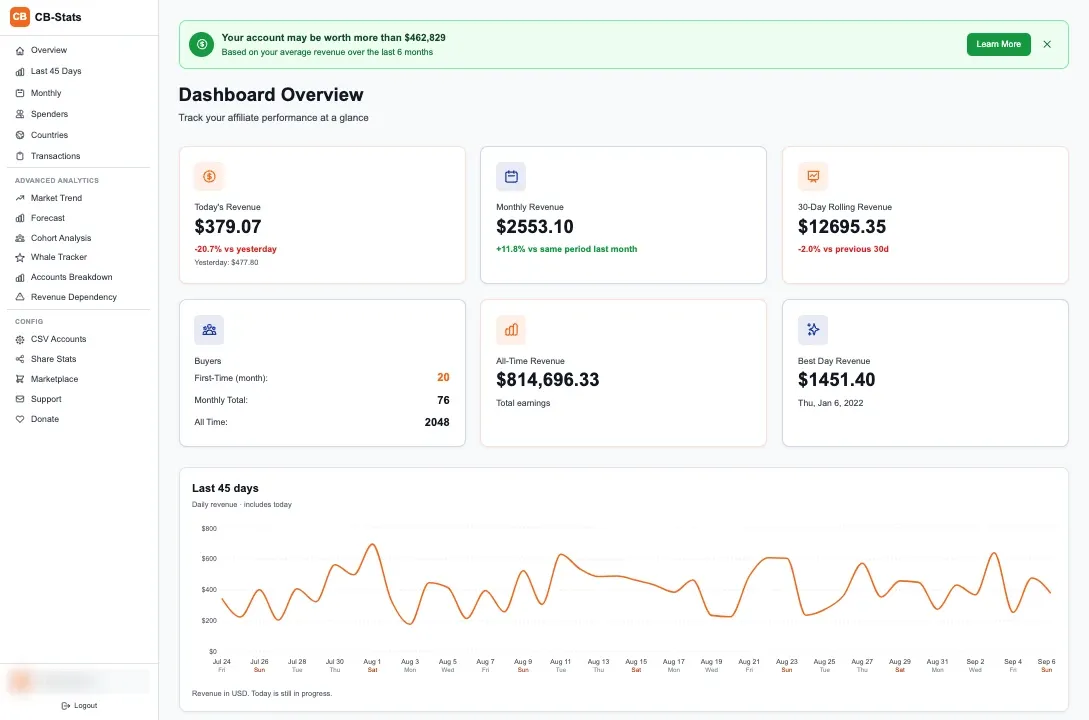
- Revenue overview: Today, yesterday, this month, with 45-day trend chart. Shows new spenders per day with tooltip details.
- Cohort analysis: Retention curve, heatmap matrix, LTV by cohort (raw and adjusted), time-based revenue patterns. See the cohort analysis article for how to read these.
- Whale tracker: Top spenders with $10,000+ lifetime spend, categorized as active/at-risk/danger/churned based on days since last purchase. 6-month spending trends per whale.
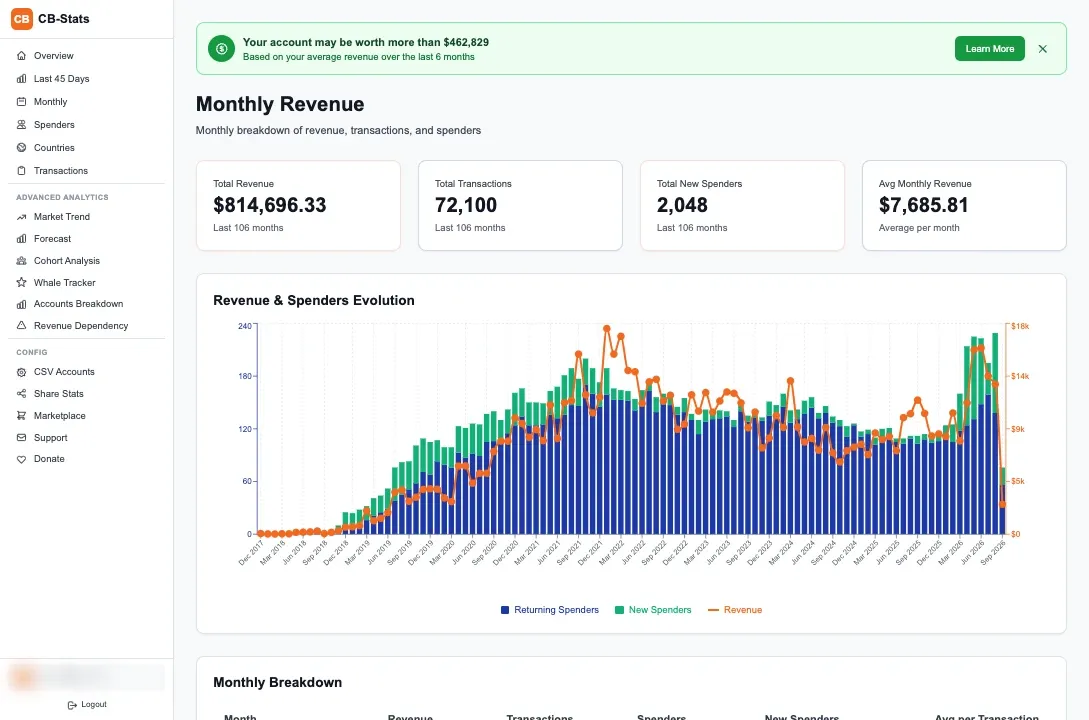
- Market trends: Platform-wide revenue trends with 90-day and 180-day rolling averages, plus 12-month year-over-year comparison charts.
- Account breakdown: Monthly revenue by affiliate account for multi-account affiliates. Stacked bar charts showing revenue distribution.
- Spender analytics: Top 100 spenders with revenue trends, plus latest 50 first-time buyers with signup dates and initial spending data.
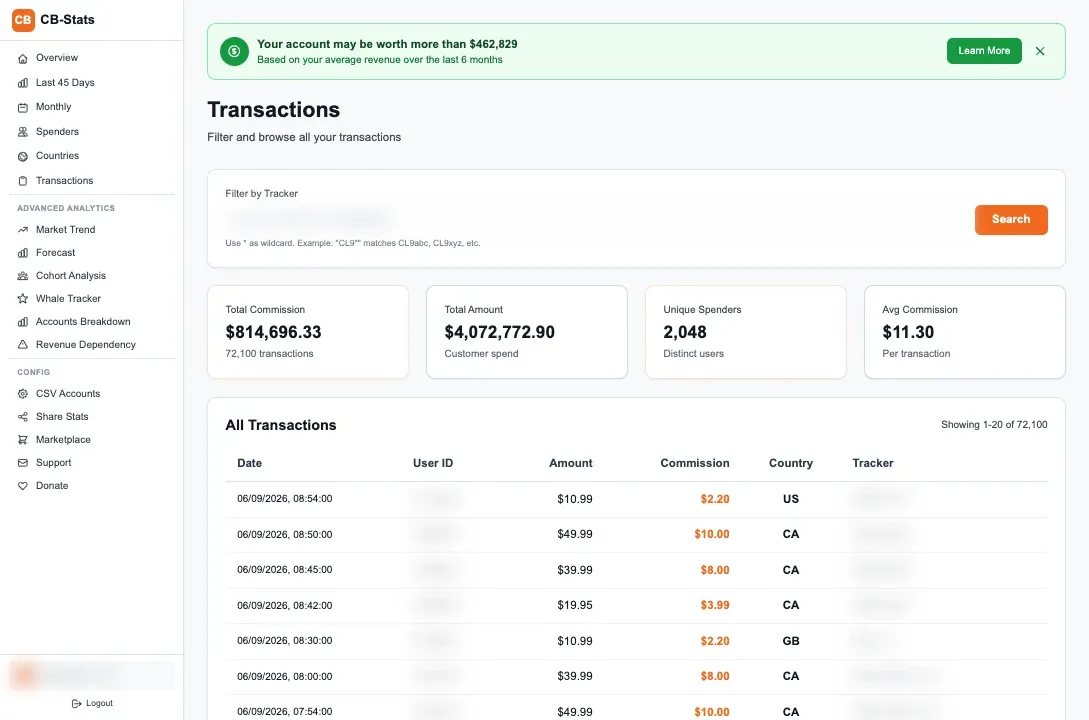
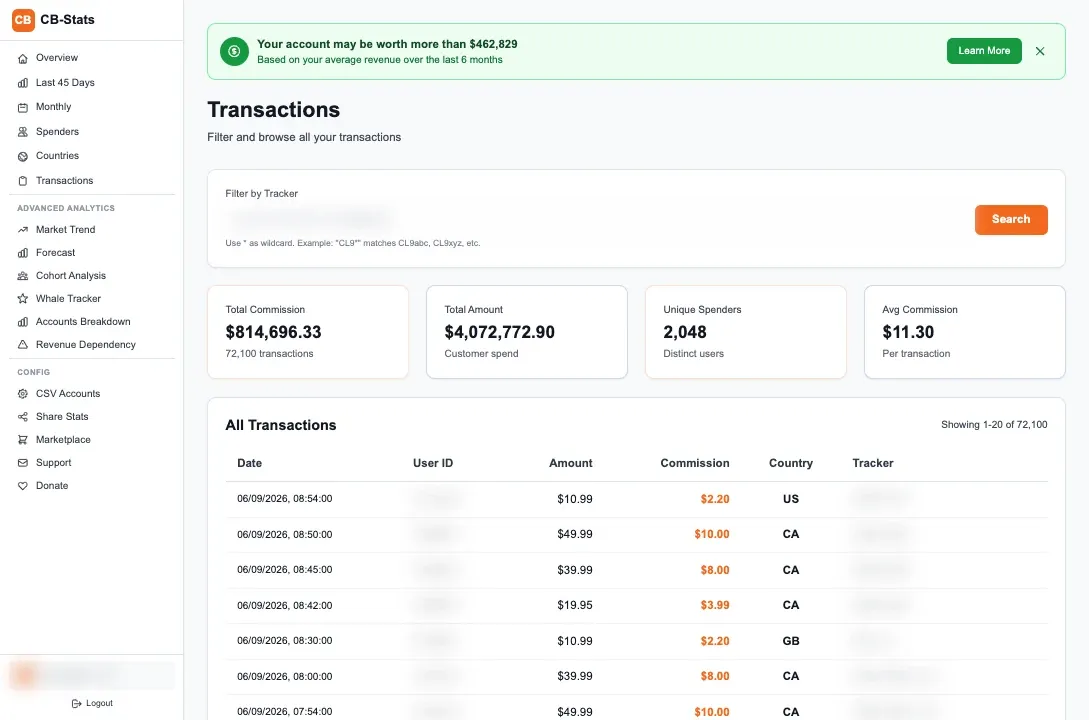
- Transaction browser: Full transaction history with filtering by date, tracker, and amount. Handles millions of rows without performance issues.
Key dashboard views every affiliate needs
Daily revenue trend with new spenders
Cohort retention curves
Whale activity status
Tracker-level revenue comparison
Year-over-year monthly comparison
Automating your reporting workflow
- Manual with reminders (easiest): Set a calendar reminder to download and import your CSV on the 1st and 15th of each month. Not automated, but at least consistent. Takes 20-30 minutes per import session.
- Semi-automated with cron jobs: Write a script that downloads your Chaturbate CSV via the stats URL, parses the data, and imports it into your database. Run it on a schedule (daily or weekly). CB-Stats supports this through a webhook endpoint for CSV sync triggers.
- Fully automated pipeline: Cron job downloads CSV data on a schedule, parses and imports to the database, and triggers a webhook to update timestamps. Your dashboard always shows fresh data with zero manual intervention. This is what I run for my accounts.
Start with manual imports and a proper dashboard tool. Get comfortable with the analytics views first. Once you know which metrics matter, automate the data pipeline. Automating a reporting process you do not understand yet just gives you bad data faster.
Frequently Asked Questions
What does CB-Stats show that Chaturbate's dashboard does not?
CB-Stats adds cohort retention analysis (grouping spenders by signup month and tracking return rates), whale spender identification and churn risk status, year-over-year revenue comparisons, seasonal trend analysis with rolling averages, multi-account aggregation, and shareable dashboard links. Chaturbate's native dashboard only shows transaction history, daily/monthly totals, and basic filtering.
Can I use Google Sheets for affiliate reporting?
Google Sheets works for accounts with under 10,000 transactions. Beyond that, performance degrades significantly with slow pivot table refreshes and import errors. For new affiliates with low volume, spreadsheets are a fine starting point. Once your transaction count grows past 10,000-20,000 rows or you need cohort analysis, you will need a database-backed tool.
How often should I check my affiliate dashboard?
Check daily revenue trends every morning (2 minutes). Review whale status and spender metrics weekly (15-20 minutes). Do a deep dive with cohort analysis, YoY comparisons, and tracker-level performance monthly (30-45 minutes). Make budget reallocation decisions quarterly based on 3-month averages.
Is CB-Stats free to use?
Yes, CB-Stats is free. You connect your Chaturbate CSV account and the platform processes your transaction data to generate all analytics views including cohort analysis, whale tracking, market trends, and account breakdowns. There are no paid tiers or feature restrictions.
Can I share my dashboard with someone without giving them my login?
Yes. CB-Stats has a share feature that generates token-based links to your dashboard views. You set an expiration date and optionally hide tracker information. Share recipients see your analytics but cannot modify anything. You can revoke share links at any time from the shares management page.