Theory18Webmasters

Affiliate programs, traffic
& earnings.

Affiliate cohort analysis: how I use monthly cohorts to predict cam site revenue

A practical walkthrough of cohort analysis for cam site affiliates. How to group spenders by signup month, measure retention, calculate LTV, and compare traffic source quality using real data from 8M+ transactions.

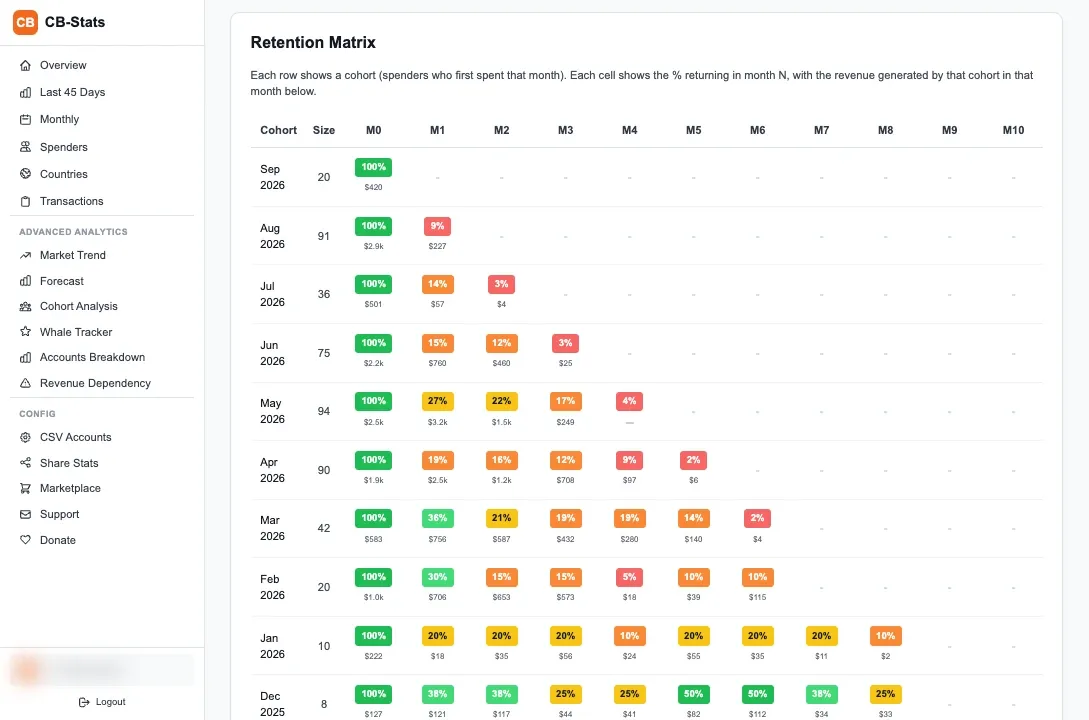
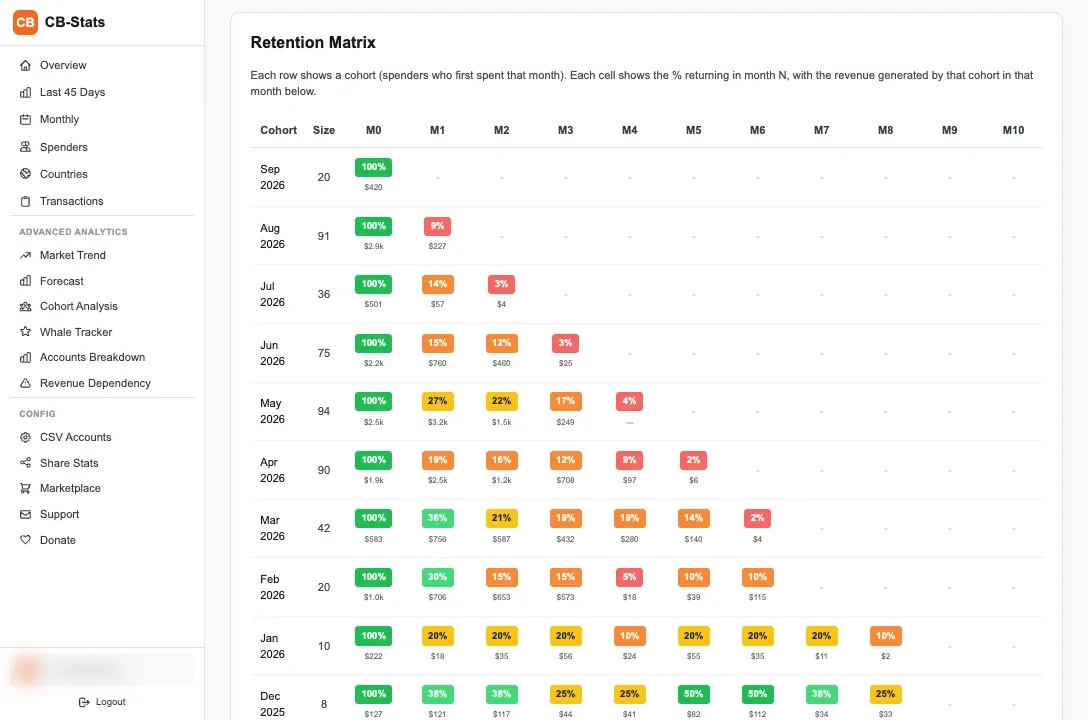
CB Stats cohort retention table with a colored monthly retention matrix.
Table of Contents

Quick answer: Affiliate cohort analysis groups your referred spenders by the month they first spent tokens, then tracks what percentage return to spend in each following month. This reveals whether your traffic quality is improving or declining over time, independent of volume changes.

Key takeaways

  • Monthly cohorts based on first transaction date are the most useful grouping for cam site affiliates because they directly map to traffic campaigns and seasonal patterns.
  • A healthy cam site cohort retains 38-45% of spenders in month 1 and 18-25% by month 6. Anything below 30% in month 1 signals a traffic quality problem.
  • Adjusted LTV (trimming top and bottom 10% of spenders) gives a more realistic revenue projection because it removes whale distortion and one-time buyers.
  • Comparing cohort retention curves across tracker tags reveals which traffic sources bring sticky spenders vs. one-and-done signups.
  • CB-Stats generates cohort retention matrices and LTV calculations automatically from your CSV data with no manual spreadsheet work.
I spent my first 3 years as a cam site affiliate looking only at monthly totals. Revenue up, good month. Revenue down, bad month. I had no idea whether a drop came from losing existing spenders, attracting worse traffic, or seasonal fluctuation. Cohort analysis fixed that. It gave me a framework to separate traffic quality from traffic volume, and it changed how I allocate my time and budget.

What cohort analysis means for affiliates

Cohort analysis groups your referred spenders by the month they first purchased tokens, then tracks their spending behavior over each subsequent month to measure retention and revenue patterns. Instead of looking at all spenders as one blob, you see each "class" of signups independently.
Say you referred 120 new spenders in January 2025 and 95 new spenders in February 2025. Those are two separate cohorts. You then track what percentage of each group returned to spend tokens in month 2, month 3, month 4, and so on. If the January cohort has 42% retention in month 2 but the February cohort only has 28%, something changed. Maybe you shifted traffic sources, maybe a landing page changed, maybe it is seasonal.
The point is this: monthly revenue can go up while cohort quality goes down. You might be adding more signups but each cohort retains worse than the last. Without cohort analysis you would not see the problem until months later when the weaker cohorts stop spending and revenue drops.

Cohort analysis answers the question "are the spenders I referred last month better or worse than the ones I referred 6 months ago?" Monthly revenue totals cannot answer this because they mix old and new spenders together.

Setting up monthly cohorts for cam site spenders

Each cohort is defined by the month of a user's first token purchase on your affiliate account, and you need at least 6 months of transaction data to start seeing useful retention patterns. The first purchase date is the anchor. Everything after that is measured relative to it.
If you are doing this manually from Chaturbate CSV exports, the process works like this.
1

Export your transaction CSV data

Download your Chaturbate stats CSV covering at least 6 months. Each row contains a transaction with user_id, amount, date, and tracker.

2

Find each user's first transaction date

Group transactions by user_id and take the minimum date_bill value. This is their cohort assignment date. A user who first spent on January 15th belongs to the January 2025 cohort.

3

Track return activity by month offset

For each user, check whether they made any purchase in month 1 (the next calendar month after their first purchase), month 2, month 3, and so on. A boolean per month is enough.

4

Calculate retention percentages

For each cohort, divide the number of users who returned in month N by the total cohort size. January cohort had 120 spenders and 51 returned in month 1? That is 42.5% month-1 retention.

In practice, doing this in a spreadsheet gets messy fast once you have thousands of users and 12+ months of data. I built the cohort analysis feature in CB-Stats because I got tired of pivot table errors at 3am.

Reading a cohort retention matrix

A retention matrix is a grid where each row is a cohort (month of first purchase), each column is a month offset (months since first purchase), and each cell shows the percentage of that cohort still active. It is the single most information-dense view of your affiliate business health.
Here is a simplified example from one of my accounts.
CohortSizeMonth 1Month 2Month 3Month 4Month 5Month 6
Jul 202513444%31%26%22%20%19%
Aug 202511841%28%23%20%18%-
Sep 202514246%34%29%24%--
Oct 202512739%27%21%---
Nov 202510843%30%----
Dec 202515147%-----
Reading this grid: the September 2025 cohort is the strongest. It started with 142 spenders and retained 46% in month 1, which is above my benchmark of 40%. By month 3, it still has 29% returning. The October cohort is weaker at 39% month-1 retention. I would go back to my tracker data for October and figure out what changed. Did I shift budget to a lower-quality traffic source? Did a landing page break?
The diagonal pattern matters too. If you read down a column, you see whether month-1 retention is improving or declining over time. If month-1 retention has dropped from 44% to 39% across 4 cohorts, your recent traffic is lower quality even if total signups went up.

TipBenchmark for cam site cohorts

Healthy month-1 retention: 38-48%. Month-3 retention: 22-30%. Month-6 retention: 15-22%. Month-12 retention: 10-16%. If you are below these ranges consistently, your traffic sources are bringing in too many one-time buyers.

Cohort LTV calculations and what they tell you

Cohort LTV (lifetime value) is the average total commission earned per spender in a cohort, and comparing LTV across cohorts tells you whether each new group of spenders is worth more or less than previous ones. This is the number that directly predicts future revenue from current traffic.
Raw LTV is straightforward: total commission from all users in the cohort divided by number of users. If the July 2025 cohort of 134 spenders has generated $14,740 in total commission after 6 months, the raw 6-month LTV is $110 per spender.
The problem with raw LTV is whale distortion. If one user in the July cohort spent $4,200 in commission by themselves, they pull the average up by $31 per spender. That one user makes the entire cohort look better than it actually is for the other 133 people.

Adjusted LTV removes outliers

I use a trimmed mean for LTV: remove the top 10% and bottom 10% of spenders by total spend, then calculate the average on the remaining 80%. This is what CB-Stats calls "adjusted LTV" and it gives a much more realistic picture of what a typical referred spender is worth.
CohortRaw LTV (6mo)Adjusted LTV (6mo)Difference
Jul 2025$110$72-35%
Aug 2025$94$68-28%
Sep 2025$128$81-37%
Oct 2025$87$65-25%
The September cohort still looks best on adjusted LTV ($81 vs. $65-$72 for the others), which confirms its retention advantage is real and not just propped up by one big spender. October has the smallest gap between raw and adjusted, meaning its spenders are more evenly distributed but just lower value overall.
I use adjusted LTV for revenue forecasting and raw LTV for tracking whale potential. Both numbers matter, but adjusted LTV is what I build my budget around because it is more predictable. See the revenue forecasting guide for how I project future earnings from cohort data.

Comparing cohort quality across traffic sources

The most actionable use of cohort analysis is splitting cohorts by tracker tag (traffic source) and comparing their retention curves side by side to see which sources bring spenders who stick around. A source with fewer signups but higher retention often generates more lifetime revenue.
I assign a unique tracker tag to every traffic source: seo-review, seo-info, reddit-sub, twitter-promo, paid-display, and so on. Then I run cohort analysis separately for each tag. The results are usually surprising.
Traffic sourceAvg cohort size/moMonth-1 retentionMonth-6 retentionAdjusted 6mo LTV
SEO (review pages)3852%26%$94
SEO (informational)4443%19%$71
Reddit posts2731%11%$43
Twitter/X promos1836%14%$56
Paid display ads3134%12%$48
SEO review traffic has a 52% month-1 retention rate and $94 adjusted LTV. Reddit has 31% and $43. That means one spender from review content is worth 2.2x a spender from Reddit. Even though Reddit delivers more signups some months, the LTV gap means I earn more per hour of effort on review content.
This does not mean I abandon Reddit. It means I set realistic expectations for Reddit-sourced revenue and do not over-invest there. If I have 10 hours a week, I might spend 5 on review content, 2 on informational SEO, and 1 each on Reddit, Twitter, and paid ads. Cohort data drives that allocation.
Run this comparison quarterly. Traffic source quality shifts over time. Reddit spender quality improved on my accounts in late 2025, possibly because I started targeting more specific subreddits instead of broad adult ones. The data showed the change before I would have noticed it from revenue totals.

Using CB-Stats cohort dashboard for analysis

CB-Stats generates cohort retention matrices, LTV calculations, and time-based spending patterns automatically from your Chaturbate CSV data, so you get the analysis without building spreadsheets. The cohort dashboard is at /dashboard/cohorts once your CSV accounts are connected.
The dashboard has four main views.
  • Retention curve chart: Shows the percentage of each cohort returning over time as a line graph. You can spot retention improvements or declines at a glance by comparing curve shapes.
  • Retention heatmap matrix: The grid view described above with color coding. Green cells are above your baseline retention, red cells are below. 12 cohorts by 12 months.
  • LTV by cohort table: Both raw and adjusted LTV (trimmed top/bottom 10%) for each cohort, so you see true spender value without whale distortion.
  • Time-based insights: Best performing hour of day, day of month, and month of year for revenue. These patterns help you time content publishing and ad spend.
The combined chart with retention percentage on the left axis and average revenue per spender on the right axis is the view I check most often. It shows whether higher retention actually translates to higher revenue, which it usually does but not always. Some cohorts retain well but at low spending levels.

Export your Chaturbate stats CSV and connect it to CB-Stats. The cohort analysis runs on your full transaction history, so the more data you have, the more complete the picture. Accounts with 12+ months of data get the most useful retention curves.

I review cohort data on the first of every month. I compare the latest 3 cohorts against my 12-month average for month-1 retention and adjusted LTV. If both metrics are declining, I dig into my tracker tags to find which traffic source degraded. If both are improving, I look at what I changed and do more of it.

Frequently Asked Questions

What is a good month-1 cohort retention rate for cam site affiliates?

A healthy month-1 retention rate for cam site referred spenders is 38-48%. This means 38-48% of users who made a first token purchase in a given month come back to purchase again the following month. Below 30% consistently indicates a traffic quality problem where you are attracting one-time buyers rather than repeat spenders.

How many months of data do I need for useful cohort analysis?

You need at least 6 months of transaction data to see meaningful retention patterns. With 6 months you can track your earliest cohort through 5 months of retention. 12 months is ideal because it lets you see full annual patterns including seasonal effects on retention and LTV.

What is the difference between raw LTV and adjusted LTV?

Raw LTV is total commission divided by number of spenders in the cohort. Adjusted LTV removes the top 10% and bottom 10% of spenders before calculating the average. Adjusted LTV is more useful for forecasting because it eliminates whale distortion (one big spender inflating the average) and one-time micro-spenders dragging it down.

Can I do cohort analysis with Chaturbate native stats?

No. Chaturbate's affiliate dashboard shows transaction history and totals but does not group users into cohorts or calculate retention rates. You need to either process your CSV export manually in a spreadsheet or use an analytics tool like CB-Stats that builds cohort analysis automatically from your transaction data.

How often should I review cohort data?

Monthly is the right cadence. On the first of each month, compare your latest 3 cohorts against your 12-month averages for month-1 retention and adjusted LTV. Quarterly, do a deeper review comparing cohort quality across traffic sources using tracker tags to reallocate your time and budget.
Theory18 community

Join the conversation

Loading comments…