Table of Contents
Quick answer: Cam site spender retention averages 38-42% after month 1, drops to 25-30% by month 3, and stabilizes around 12-16% at month 12. Improving retention by even 5 percentage points at the 6-month mark can increase lifetime value per spender by 30-40%.
Key takeaways
- A 5% improvement in 6-month retention increases average spender LTV by 30-40% because retained users spend more per month over time, not less.
- SEO-acquired spenders retain at 34% after 6 months versus 21% for Reddit-acquired spenders on my accounts.
- The first 30 days after a spender's initial purchase is the highest-churn window. 58-62% of one-time buyers never make a second purchase.
- Cohort analysis by acquisition month reveals that Q1 cohorts (January-March) retain 15-20% better than Q3 cohorts (July-September).
- You cannot directly influence retention as an affiliate, but you can choose traffic sources that produce higher-retention spenders.
Why spender retention matters more than new signups
DataRetention math
If you refer 50 new spenders per month at $12 average first-month commission, that is $600/month in new revenue. If your 6-month retention is 25%, after 6 months you have ~75 active retained spenders generating ~$1,050/month in recurring commission. The retained base overtakes new acquisition revenue by month 4.
Retention metrics every affiliate should track
Cohort retention rate
| Months since first purchase | Typical retention rate | My account average |
|---|---|---|
| Month 1 (first 30 days) | 100% (baseline) | 100% |
| Month 2 | 38-42% | 41% |
| Month 3 | 28-32% | 30% |
| Month 6 | 18-24% | 22% |
| Month 9 | 14-18% | 16% |
| Month 12 | 12-16% | 14% |
| Month 18 | 9-12% | 11% |
| Month 24 | 7-10% | 9% |
Lifetime value (LTV)
Monthly churn rate
The typical cam site spender lifecycle
Phase 1: Trial (month 1)
Phase 2: Habit formation (months 2-4)
Phase 3: Steady state (months 5-12)
Phase 4: Decline and churn
How referral source affects retention quality
| Traffic source | Month 2 retention | Month 6 retention | Month 12 retention | Median LTV |
|---|---|---|---|---|
| SEO (review content) | 52% | 34% | 21% | $52 |
| SEO (informational) | 46% | 28% | 16% | $41 |
| Reddit / forums | 35% | 21% | 11% | $26 |
| Social media | 31% | 19% | 10% | $22 |
| Paid display ads | 29% | 18% | 9% | $19 |
Using CB-Stats cohort analysis for retention tracking
- Retention curve chart: plots the percentage of each cohort still active over 12 months. Lets you compare cohort quality at a glance. If your January cohort curve is above your July cohort curve, your Q1 traffic produces better-retaining spenders.
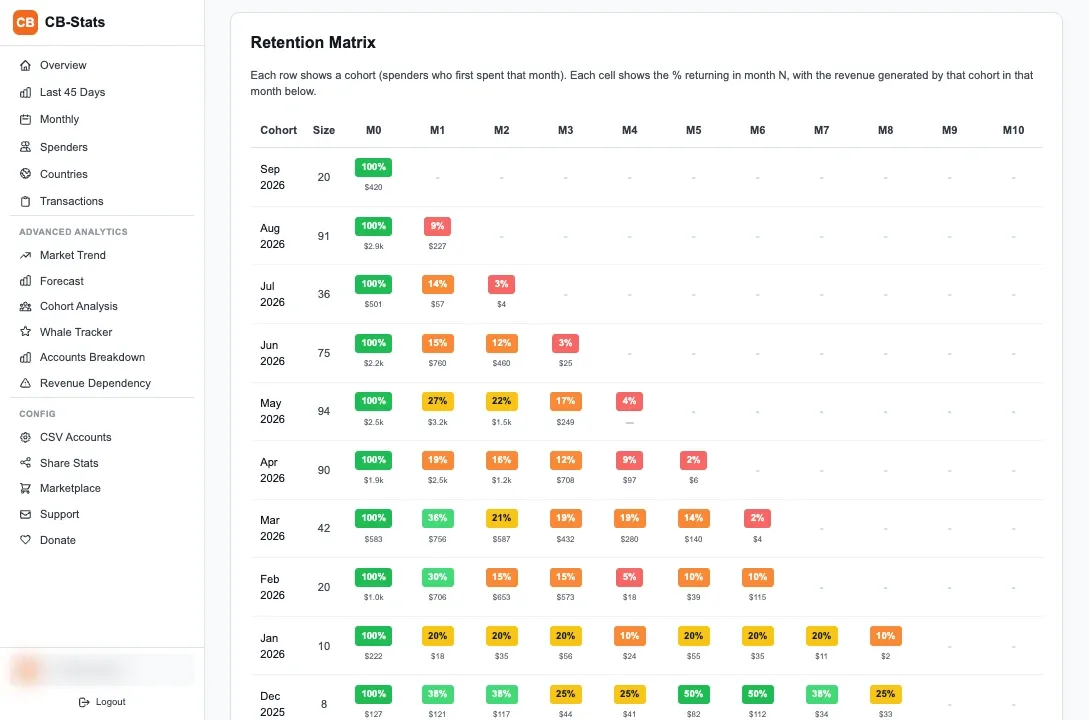
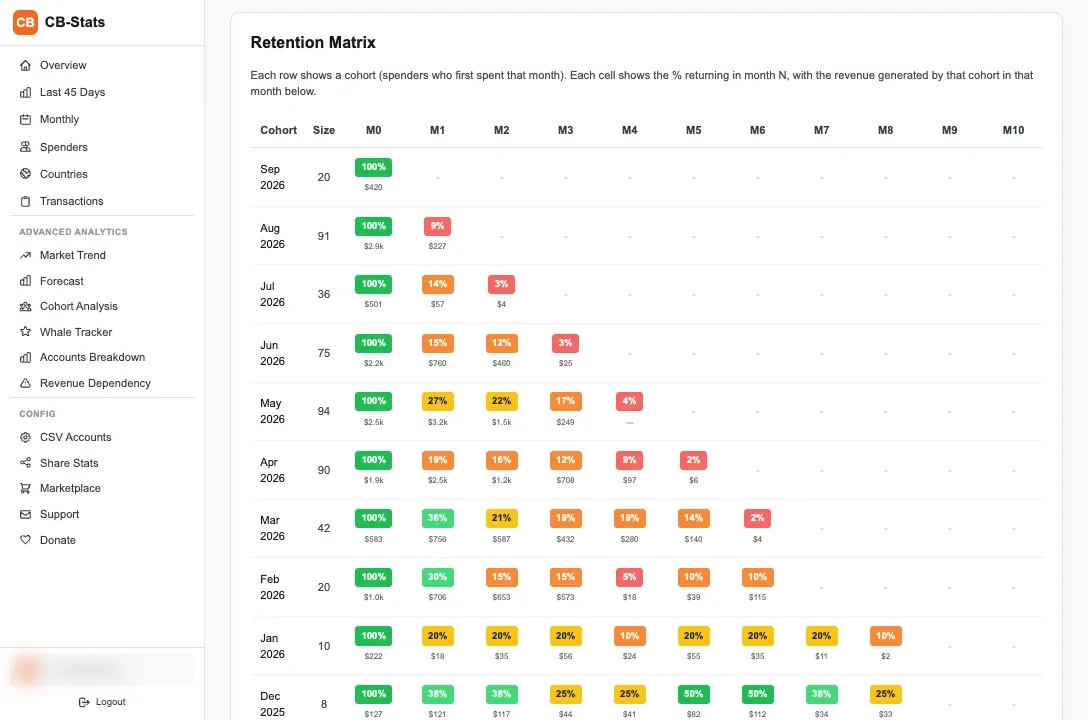
- Retention matrix heatmap: a grid where rows are cohort months and columns are months since acquisition. Each cell shows the retention percentage with color coding (green = high retention, red = low). This is where you spot trends like "all 2025 cohorts retain better than 2024 cohorts" or "summer cohorts always underperform."
- LTV by cohort table: shows the average and adjusted lifetime value for each acquisition month cohort. The adjusted figure removes top and bottom 10% outliers so a single whale or a batch of one-time buyers does not distort the cohort's actual performance.
Compare cohorts acquired from different tracker tags to measure retention by traffic source. If your "seo_review" tracker shows 34% 6-month retention and your "reddit_sidebar" tracker shows 19%, that tells you exactly where to focus your content efforts.
Improving retention through traffic source optimization
Pull cohort retention by tracker tag
In CB-Stats, check which tracker tags produce spenders with the highest 3-month and 6-month retention rates. Rank your traffic sources by retention, not by signup volume.
Calculate effective LTV per traffic source
Multiply spender conversion rate by average LTV for each source. A source with 8% spender conversion and $52 median LTV is worth more than a source with 15% conversion and $19 LTV.
Reallocate budget toward high-retention sources
Shift 20-30% of your content or ad budget from low-retention sources to high-retention ones. Do not kill low-retention sources entirely because they still contribute to your spender pipeline.
Test new sources with dedicated tracker tags
Every new traffic source gets its own tracker tag. Run it for 90 days minimum before evaluating retention. Shorter periods do not give you enough data because the month-2 to month-3 retention drop is where most of the signal is.
Review results next quarter
Check whether the reallocation improved overall portfolio retention. Compare the current quarter's cohort retention curves against the previous quarter.
Frequently Asked Questions
What is a good spender retention rate for cam site affiliates?
A 6-month retention rate of 20-25% is average across the industry. Above 28% is strong performance, usually indicating high-quality traffic from SEO or niche content. Below 15% suggests your traffic sources attract casual browsers who do not convert into repeat buyers. These rates are based on the percentage of spenders still making purchases 6 months after their first token purchase.
How do you calculate cam site spender lifetime value?
Spender LTV is the total commission earned from a referred user over their entire account lifetime. To calculate it, sum all commission from a user's referred transactions. For a portfolio-level metric, take the average or median across all referred spenders. CB-Stats calculates both standard and adjusted LTV (removing top/bottom 10% outliers) for more accurate benchmarking.
Why do most first-time cam site spenders never buy again?
Approximately 58-62% of first-time token buyers do not make a second purchase. The primary reasons are: the first purchase was curiosity-driven with no intent to return, the user did not connect with a specific model (which is the main driver of repeat spending), or the user found the pricing too high for ongoing use. This one-time buyer rate is consistent across traffic sources.
Can affiliates improve spender retention directly?
No. Affiliates cannot contact referred users or influence their experience on the platform. Retention is driven by the user's relationship with models, the platform experience, and personal spending capacity. What affiliates can control is which traffic sources they invest in. Sources that attract higher-intent users (SEO review content, comparison pages) produce spenders with 40-60% better retention than low-intent sources (display ads, pop-unders).
How long does the average cam site spender stay active?
The median active spender lifetime is 4.2 months when including one-time buyers. Excluding one-time buyers (users who only made a single purchase), the median rises to 11.3 months. The top 10% of spenders remain active for 24+ months. Spender lifetime varies significantly by traffic source, with SEO-acquired users averaging 6.1 months versus 3.2 months for paid ad acquired users.