Affiliate revenue forecasting: predict your earnings before they happen
A practical guide to affiliate revenue forecasting covering 3 models that work for cam affiliates, how to adjust for seasonality, building a monthly projection spreadsheet, and the common mistakes that make forecasts useless.
By Clement9 min read
Table of Contents
Quick answer: Affiliate revenue forecasting uses your historical transaction data, spender churn rates, and new acquisition trends to project future monthly earnings. For cam affiliates on revshare, a simple cohort-based model that tracks active spenders x average revenue per spender, minus expected churn plus projected new spenders, is accurate within 8-12% for 30-day forecasts.
Key takeaways
The 3 forecasting models for cam affiliates are trend-based (simplest), cohort-based (most accurate), and traffic-based (best for planning new campaigns).
A cohort-based forecast was accurate within 9% of actual revenue for 11 out of 12 months in my 2025 data. The miss was December, which I underestimated because holiday spending spiked.
Seasonality adjustments are mandatory. Cam site spending peaks November through February (+15-25%) and dips June through August (-10-18%). Ignoring this creates 20%+ forecast errors.
Revshare compounding makes cam affiliate revenue more predictable over time. After 24+ months, your revenue floor from retained spenders stabilizes and new spenders add growth on top.
The biggest forecasting mistake is using total revenue trends without accounting for churn. Revenue can grow while your spender base shrinks if a few whales increase spending.
In January 2025 I guessed my February revenue would be about $14,000 because January paid $13,800. February came in at $11,200. I lost $2,600 in expected income not because anything went wrong, but because January had a holiday spending bump I did not account for. That month I built my first forecasting model. Since then, my 30-day projections have been within 9% of actual revenue, and my quarterly projections within 14%. Here is how I do it.
How to forecast affiliate revenue accurately
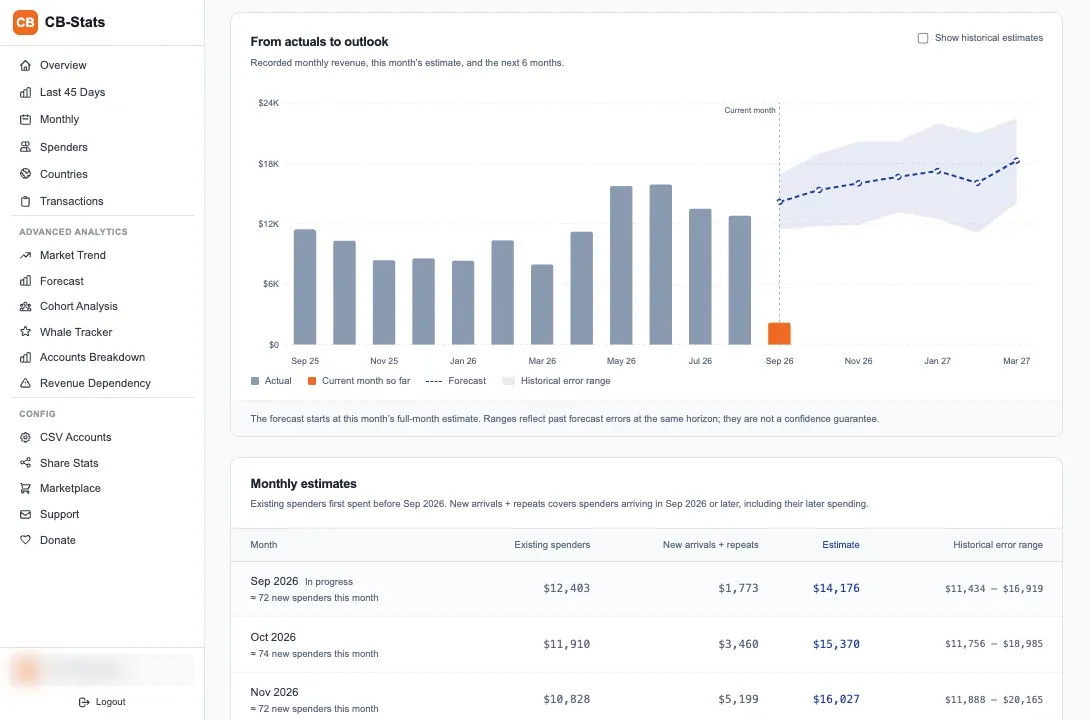
Accurate affiliate revenue forecasting requires 3 inputs: your current active spender count, your average revenue per spender, and your monthly churn rate, combined into a formula that projects forward while accounting for new spender acquisition. The math is straightforward once you have the data. The hard part is getting clean data, which is where tracking tools become non-negotiable.
The basic formula for next month's revenue is: (current active spenders - expected churn + expected new spenders) x average revenue per spender. If you have 420 active spenders, lose 8% per month to churn (34 spenders), gain 25 new spenders, and average $9.20 in commission per spender, your projection is (420 - 34 + 25) x $9.20 = $3,781. That is your baseline estimate.
This formula gets more accurate with more historical data. After 12+ months of tracking, your churn rate stabilizes around a consistent number (mine hovers between 7-9% monthly). Your average revenue per spender fluctuates seasonally but within a predictable range ($8.40-$11.60 in my data). The only variable that swings wildly is new spender acquisition, which depends on your traffic growth. The analytics tracking hub covers how to measure all of these inputs reliably.
DataMy 2025 forecast accuracy
Across 12 months of 2025, my cohort-based model predicted monthly revenue within 9% for 11 months. Average error was 6.8%. The single miss above 9% was December (predicted $16,200, actual $18,900) because I underestimated the holiday spending surge. Adding a seasonal multiplier for December fixed this for 2026 projections.
Revenue forecasting models for cam affiliates
The 3 forecasting models that work for cam affiliates are trend-based (uses recent revenue trajectory), cohort-based (tracks spender groups over time), and traffic-based (projects from visitor acquisition rates). Each has different accuracy levels and data requirements. I use cohort-based for monthly projections and traffic-based for planning new campaigns.
Trend-based forecasting
The simplest model. Take your last 3-6 months of revenue, calculate the average monthly growth rate, and project forward. If your revenue grew from $8,000 to $9,200 to $10,100 over 3 months (average growth of ~12.4%), your next month projection is about $11,350. This works when your business is in a steady state with consistent traffic and no major seasonal shifts. It breaks down during holiday months or when you launch (or lose) a major traffic source.
I used trend-based forecasting for my first 8 months because I did not have enough cohort data to build anything better. It was accurate within 15% most months, which is good enough for rough budgeting. The main flaw: it cannot distinguish between revenue growth from new spenders versus revenue growth from existing spenders spending more. Those two scenarios have very different implications for future months.
Cohort-based forecasting
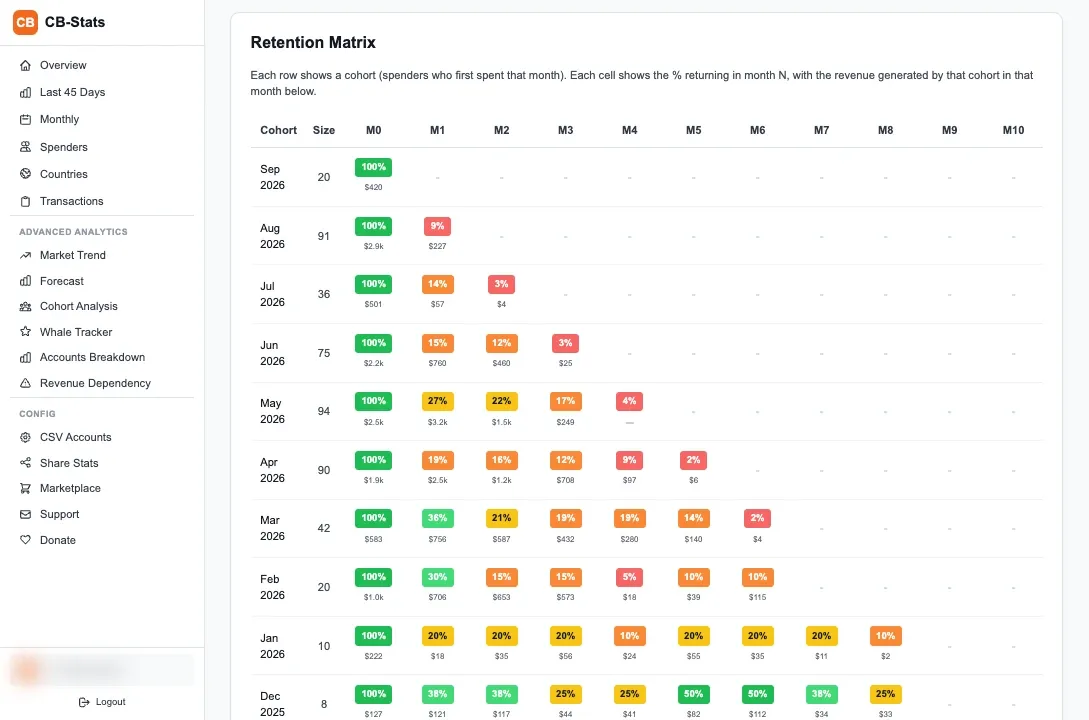
The most accurate model for revshare affiliates. Group your spenders by the month they made their first purchase (their cohort). Track what percentage of each cohort is still active in subsequent months. Use those retention curves to predict how much revenue each existing cohort will generate next month, then add projected revenue from new spender acquisition.
Here is a concrete example from my data. My January 2025 cohort started with 28 new spenders averaging $9.80/month in commission. By month 6, retention was at 54% (15 active spenders). By month 12, retention was at 31% (roughly 9 active spenders). Using this curve, I can project that my January 2025 cohort will generate about $88/month in commission at month 12. I apply this same calculation to every cohort, sum them up, and add my projected new spender revenue. The cohort analysis guide covers retention curve measurement in detail.
Traffic-based forecasting
Best for planning new campaigns. If you know your conversion rates per traffic source, you can project the revenue impact of increasing traffic by X%. For example: my "best cam sites" page gets 3,200 monthly visitors with a 1.4% visitor-to-spender rate (45 new spenders/month) and each spender generates $9.20/month. If I can increase traffic to that page by 30% through link building, I add ~13 new spenders/month, which adds ~$120/month in recurring commission. Over 12 months, those 13 monthly new spenders compound into roughly $7,800 in additional annual revenue.
✓ Pros
+Trend-based: quick, requires only 3-6 months of revenue history, good for rough estimates
+Cohort-based: most accurate (6-9% error rate), accounts for churn and retention patterns
+Traffic-based: best for ROI calculations on new campaigns and traffic investments
-Cohort-based: needs 12+ months of data and cohort tracking tools like CB-Stats
-Traffic-based: depends on accurate conversion rates that may shift when you change traffic volume
Using historical data to predict future earnings
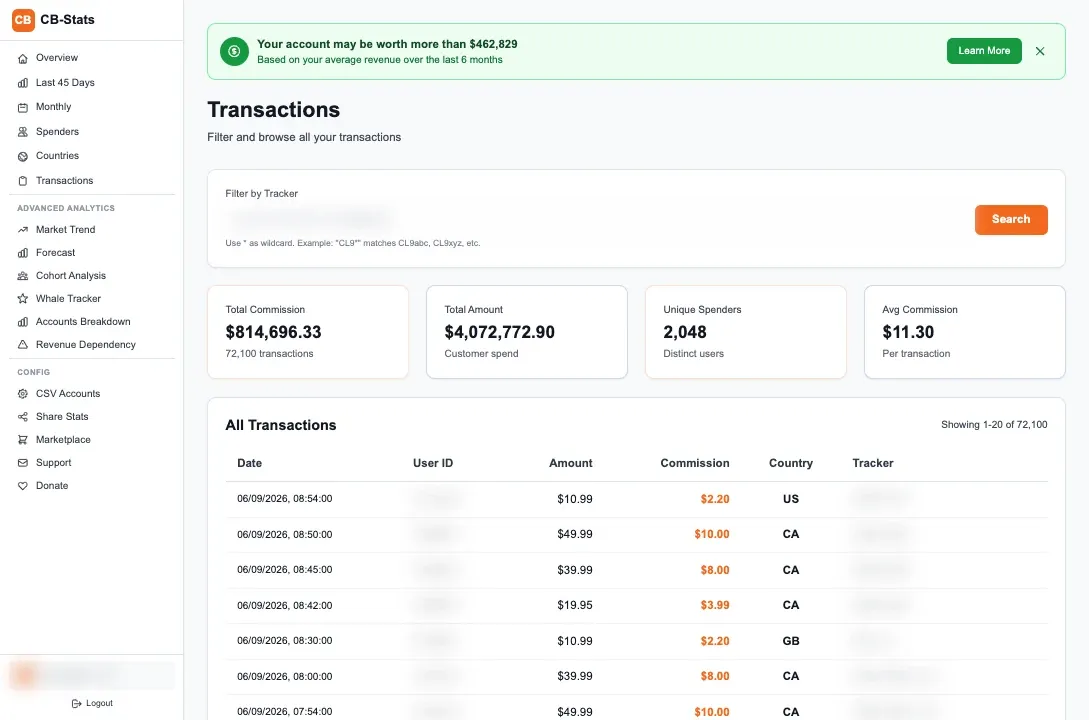
Historical data becomes predictive when you have 12+ months of transaction-level records that let you calculate churn rates, seasonal patterns, and cohort retention curves specific to your traffic sources. Less than 12 months and your sample size is too small to separate signal from noise. More than 24 months and your older data may not reflect current traffic quality.
The first metric to extract from historical data is your monthly churn rate. Pull the list of spenders who were active last month and check how many transacted this month. The percentage who did not is your churn rate. In my data, this number bounces between 7% and 9% monthly, depending on the time of year. Summer months have higher churn (9-10%) because users spend less time on cam sites. Winter months drop to 6-7%.
The second metric is average revenue per active spender (ARPS). Sum your monthly commission, divide by active spenders. My ARPS ranges from $8.40 in July to $11.60 in December. Those seasonal swings are consistent year over year. Knowing them lets you adjust your monthly forecast by +/- 15% depending on the month.
The third metric is new spender acquisition rate. How many first-time spenders appear each month, and from which sources? This number depends on your traffic growth and conversion rates. If you are not growing traffic, your new spender rate will slowly decline as you exhaust your addressable audience on existing channels. If you are launching new content and channels, it should grow. CB-Stats tracks new spenders per day and per tracker, which feeds directly into your forecasting model.
I pull these 3 numbers from CB-Stats every month and plug them into my projection spreadsheet. The formula is simple: next month revenue = (active spenders x (1 - churn rate) + projected new spenders) x seasonal ARPS. For a broader perspective on how historical patterns affect cam affiliate earnings, read the seasonal revenue trends guide.
Accounting for seasonality in forecasts
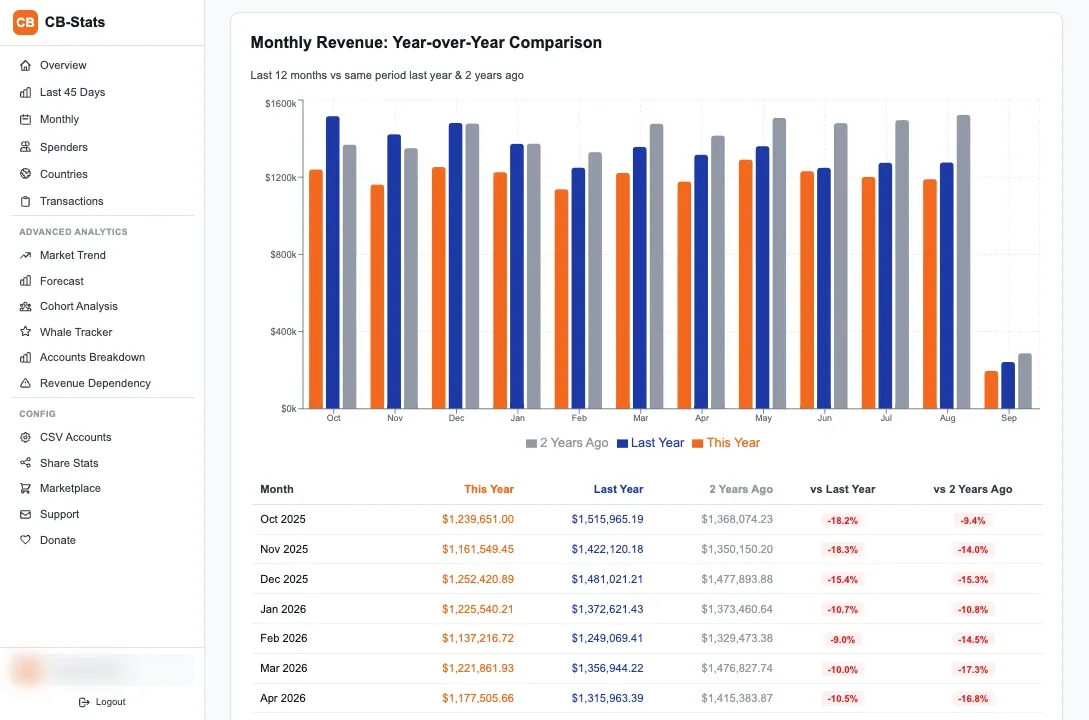
Cam site affiliate revenue follows a predictable seasonal pattern: spending peaks from November through February (15-25% above annual average) and dips from June through August (10-18% below average). Ignoring this pattern is the single fastest way to produce a forecast that is off by 20%+. I learned this the hard way when my January-to-February forecast missed by $2,600.
These seasonal indices come from 3 years of my own Chaturbate data (2023-2025). Your numbers may differ by a few percentage points depending on your traffic geography and audience demographics, but the overall shape, peak in winter, trough in summer, is consistent across every cam affiliate I have compared notes with.
To apply seasonal adjustment, multiply your base forecast by the seasonal index for the target month. If your base model projects $10,000 for July, multiply by 0.82 to get a seasonally adjusted projection of $8,200. Without this adjustment, you would expect $10,000 and spend the month wondering what went wrong when only $8,300 came in.
TipBudget around the dip
Knowing that June-August revenue drops 10-18% lets you plan ahead. I front-load content production into Q1 and Q2 when revenue is strong, then coast on existing content during summer. I also set aside 2 months of expenses from Q4 earnings to cover any summer cash flow gaps.
Building a monthly revenue projection spreadsheet
A monthly revenue projection spreadsheet needs 5 columns: month, active spenders (start), churn, new spenders, and projected revenue, with seasonal multipliers applied to the revenue calculation. I maintain mine in Google Sheets and update it on the first of each month with actuals from CB-Stats. The entire update takes 5 minutes.
Here is how to build it from scratch. Create a row for each of the next 12 months. In the first row, enter your current active spender count from CB-Stats. For churn, multiply active spenders by your historical churn rate (use 8% if you do not have your own data yet). For new spenders, use your average monthly acquisition from the past 3 months. The "active spenders start" for month 2 equals month 1's starting spenders minus churn plus new spenders.
Month
Active spenders (start)
Churn (8%)
New spenders
Active (end)
ARPS
Seasonal index
Projected revenue
Mar 2026
420
34
25
411
$9.40
1.02
$4,188
Apr 2026
411
33
25
403
$9.40
0.97
$3,676
May 2026
403
32
25
396
$9.40
0.94
$3,501
Jun 2026
396
32
25
389
$9.40
0.88
$3,220
Jul 2026
389
31
25
383
$9.40
0.82
$2,954
Aug 2026
383
31
25
377
$9.40
0.86
$3,050
The table above shows a simplified 6-month projection for an affiliate with 420 active spenders, 8% monthly churn, and 25 new spenders per month. Notice how revenue declines slightly even with consistent new acquisition because churn outpaces growth by about 7-9 spenders per month. To grow, this affiliate needs either higher new spender acquisition or lower churn. The ROI calculation guide covers how to evaluate whether investing in more traffic is worth the cost.
Adjust the model as you get actuals each month. If March comes in at $4,350 instead of $4,188, your inputs were slightly conservative. Update your ARPS and churn rate with the real numbers and re-project forward. After 3-4 months of calibration, the model gets tight. My model stabilized to under 9% error after 4 months of adjustments.
When forecasts fail: common pitfalls
Forecasts fail most often when they ignore whale concentration, assume constant churn rates, or do not account for traffic source changes. A model that works for 8 months can suddenly miss by 25% if one of these factors shifts without adjustment.
Whale dependency distortion
If your top 10 spenders generate 25%+ of your revenue, losing 2-3 of them in the same month can blow a 15% hole in your forecast that the model did not predict. My October 2024 revenue dropped 19% because 3 whale spenders churned within the same week. My model had predicted a 2% dip. I now track whale concentration separately and add a risk buffer to my forecast when whale dependency exceeds 20%. The cohort analysis approach helps identify aging whales before they churn.
Assuming constant churn
Churn is not constant. It varies by season (summer churn runs 1-2% higher), by cohort age (new spenders churn faster than established ones), and by platform changes (Chaturbate ran a promotion in Q3 2024 that temporarily reduced churn by 3%). Using a single churn number works for rough projections, but if you want sub-10% accuracy, you need to track churn by cohort age and adjust seasonally.
Ignoring traffic source shifts
A Google algorithm update in August 2025 dropped traffic to 3 of my pages by 40%. My forecast model, which assumed steady traffic, predicted $12,400 for September. Actual was $10,100. The model could not see the traffic change because it only looked at spender data. Now I cross-reference Google Search Console traffic data with my revenue projections. If organic traffic drops 20%+, I manually adjust my new spender acquisition assumption downward.
Overfitting to recent months: using only the last 2-3 months of data makes your forecast too sensitive to short-term fluctuations. Use 6-12 months minimum.
Ignoring platform changes: new token packages, price changes, or promotional events shift user spending patterns in ways your model cannot anticipate. Track platform announcements.
Projecting growth without capacity: forecasting 30% more new spenders without a plan for 30% more traffic is just wishful thinking. Tie acquisition projections to specific traffic initiatives.
Not updating the model: a forecast is only as good as its last calibration. Update with actuals monthly or the model drifts.
Revenue forecasting is not about perfect accuracy. It is about being close enough to make better decisions than guessing. A model that is right within 10% lets you budget for tools, plan content investments, and set realistic income expectations. That is worth the 30 minutes per month it takes to maintain. For the broader analytics setup that feeds these forecasts, start with the affiliate analytics tracking guide.
Frequently Asked Questions
How accurate can affiliate revenue forecasts be?
With a cohort-based model and 12+ months of historical data, 30-day forecasts for cam affiliate revshare are typically accurate within 6-12%. Quarterly forecasts are accurate within 10-15%. The main sources of error are seasonal surprises, whale churn, and traffic source changes. Adding seasonal multipliers and a whale risk buffer improves accuracy to the lower end of those ranges.
What data do I need to start forecasting affiliate revenue?
At minimum, you need 3-6 months of monthly revenue totals for a basic trend-based forecast. For a more accurate cohort-based model, you need 12+ months of transaction-level data including user IDs, transaction dates, and amounts. CB-Stats calculates active spenders, churn rates, and cohort retention automatically from your Chaturbate CSV data.
How does revshare compounding affect revenue forecasts?
Revshare compounding means your revenue floor rises over time as long as new spender acquisition exceeds churn. After 24+ months, the accumulated base of retained spenders creates stable recurring income that makes forecasting easier. My forecast error rate dropped from 15% in year 1 to under 9% in year 3 because the compounding base stabilized my numbers.
Should I forecast revenue per platform or combined?
Forecast per platform if you promote multiple cam sites. Each platform has different churn rates, ARPS, and seasonal patterns. Combining them into one forecast averages out platform-specific signals and reduces accuracy. I maintain separate projections for Chaturbate and Stripchat, then sum them for my total expected income.
C
About the author
Clement
Founder of CB-Stats, Chaturbate & Stripchat Super affiliate